 Nic Dunn, CEO, Charle Agency
What Is A/B Split Testing?
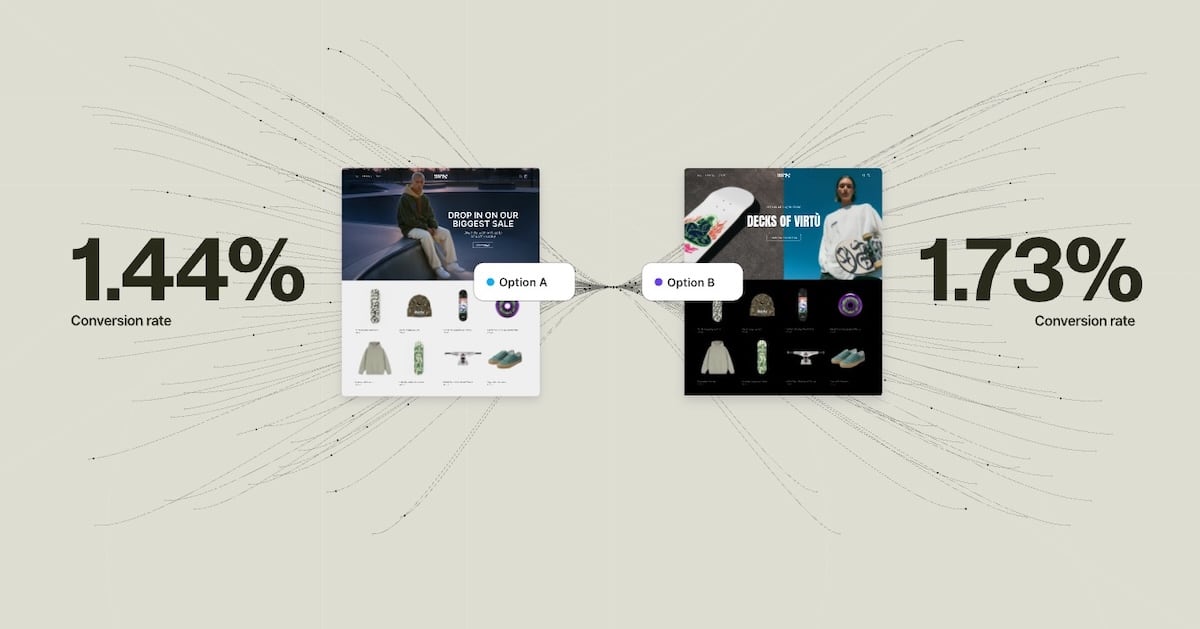
A/B split testing, also called A/B testing or split testing, is a method of comparing two versions of a web page, email, or app feature to see which one performs better. In essence, you show version A (the control page) to one group of website visitors and version B (the variant) to another, measure how each performs against a specific goal, then use the information to decide which version to keep.
The concept isn't new. Agricultural scientists used controlled experiments in the 1920s to test crop yields under different conditions. Digital marketers brought the same rigour to web optimisation in the early 2000s, and it's become foundational to how businesses make decisions about their web pages and marketing campaigns. Anyone running a website, landing page, or email campaign can benefit from the principles behind split tests.
Here's how a basic test works:
- You identify something you want to improve (a button, a headline, a form field).
- You create a variation of it, changing only that one element.
- Your testing tool randomly splits incoming website traffic between the control and variant.
- You collect data on how people behave with each version.
- When you reach statistical significance, you analyse the results and implement the winner.
The traffic split is usually 50/50, though you can adjust it if you need to test more aggressively or reduce risk to the original version. The key principle is isolation: you change one thing at a time so you know exactly what caused any differences in performance.
Why A/B Testing Matters
Without testing, you're making decisions based on opinions and guesswork. The loudest voice in the meeting, the CEO's hunch, the designer's assumptions. Testing removes that bias and replaces it with evidence, giving you real numbers to base decisions on rather than gut feeling.
Companies with structured A/B testing programmes see conversion rate improvements of 30% or more annually. That's not from one miraculous test. It's from running dozens of small split tests that compound. Data shows 60% of A/B tests deliver less than 20% improvement on their individual business metrics. That sounds underwhelming until you run 50 of them. A 2% improvement repeated 50 times compounds to a 165% overall gain. The benefits are cumulative, and that is where the real success lies.
There's also a defensive benefit. The best way to catch a "bad" change that looks good in a meeting is to test it. We've seen companies avoid costly mistakes by testing a new checkout flow and discovering it increased cart abandonment before rolling it out to 100% of users. In reality, a lot of ideas that seem like sure wins end up hurting conversion rates.
Revenue impact is tangible. For ecommerce, a 10% conversion rate lift on £100,000 monthly revenue is an extra £10,000. For SaaS, it might be 15% more signups, reducing customer acquisition costs. For publishers, it's more pageviews, more ad impressions. Testing creates direct, measurable business value for businesses of all types and sizes.
A/B Testing vs Split URL Testing vs Multivariate Testing
These terms are often used interchangeably, but they're different approaches with different use cases. Understanding the differences between each other is one of the best practices you can adopt early on.
A/B Testing runs both variations on the same URL. Your testing tool loads the control by default, then uses JavaScript to swap in the variant for the test group. You might change a button colour, headline text, font size, or form field. It's fast to set up, requires no development resources, and works for almost any element on a landing page or web page. This represents roughly 68% of all online experiments, and it makes sense for most businesses.
Split URL Testing (sometimes called redirect testing) serves the control on one URL and the variant on a completely different URL. This is essential for radical redesigns where you want to test a fundamentally different page structure, a new navigation system, or a completely different user experience. The downside: more development work, potential SEO implications if not handled carefully, and users notice they've landed on a different URL. Split URL testing is necessary when your changes are too extensive for JavaScript injection.
Multivariate Testing (MVT) tests multiple variables at the same time. Instead of changing just the button colour, you might test button colour AND button text AND button size all in one experiment. MVT can be powerful when you have enough website traffic to reach statistical significance across all combinations. The maths is demanding: testing 3 variables with 2 options each creates 8 combinations. Each needs its own sample size. MVT accounts for less than 1% of real-world experiments because most websites don't have a sufficient amount of traffic to run them effectively. Start with A/B testing. Graduate to MVT only when you have 10,000+ monthly conversions and clear hypotheses about variable interactions.
How to Run an A/B Test: Step by Step
A well-run test follows a structured process. Keep these best practices in mind at every stage. Skip steps, and you'll generate misleading outcomes.
1. Define Your Goals
What are you actually trying to improve? More signups? Higher average order value? Lower bounce rates? Be specific about your business goals. "Improve performance" isn't a goal. "Increase free trial form submissions by 5% without increasing support burden" is. Clear goals give your analysis direction and make the effectiveness of each test measurable.
2. Form a Hypothesis with a Because Clause
Don't just test a variant. Say why you think it will work: "We will change the CTA buttons from blue to red because research shows high contrast CTAs attract more clicks and our current button may be getting lost in the page hierarchy." In other words, put your assumptions into writing. This forces you to think through your reasoning and helps you learn something useful regardless of the test outcome.
3. Choose Your Metric
Which metric proves your hypothesis? If your hypothesis is about clicks, measure CTR (click-through rate). If it's about conversions, measure conversion rates. Avoid proxy metrics (measuring pageviews when you care about revenue). Understand your analytics setup well enough to know which business metrics are reliable. Keep user engagement and bounce rates as secondary metrics to watch.
4. Select Your Testing Tool
Choose based on your platform, technical ability, and traffic volume. We cover the main options later in this guide.
5. Build Your Variant
Change exactly one thing. If you change the button colour AND the button text AND add new content above it, you won't know what drove the result. Create a clear visual difference so users in both groups experience something distinctly different. Keep all other elements identical so the two versions only differ in one aspect.
6. Determine Sample Size and Duration
Use a sample size calculator (most testing tools include one) to determine the amount of website visitors you need. As a rule of thumb, run tests for a minimum of two weeks to account for day-of-week effects and user behavior variation. If you have 1,000 monthly visitors, don't expect to reach statistical significance in days. If you have 100,000 daily visitors, you might finish in hours. The length of your test matters just as much as the numbers.
7. Analyse Results and Act
Once you reach statistical significance (95% confidence is the standard), look at your results. Implement the winner. If neither version won, document what you learned and move to your next test. If the outcomes surprised you, dig into segmented data to understand why. Every test returns answers, even when the result is inconclusive.
What Should You A/B Test?
Almost anything can be tested. The question is what's worth testing based on website traffic volume and business impact. Here are the high-value elements, with examples of the types of things that consistently produce insights for others:
Headlines and Copy: Different headlines often produce 20-40% variation in user engagement. Test benefit-led vs curiosity-led language, short vs long copy, first-person vs second-person tone. Even small changes in the words you use can shift behavior significantly.
Calls to Action (CTAs): Button text, colour, size, and placement all matter. CTAs see average improvements of 28% when optimised. Test action-oriented language ("Get Started Now") against softer language ("Learn More"). The effectiveness of your CTA is one aspect that returns quick answers about what your target audience responds to.
Landing Pages: If you're running marketing campaigns or paid ads, your landing page is where conversions happen. Test hero images, headline copy, form length, and the placement of trust signals. A couple of well-placed changes on a landing page can dramatically shift conversion rates.
Forms: Field count, field order, required vs optional fields. Reducing a form from 10 fields to 5 often increases form submissions by 20-50%, though you lose some data quality. Test where your trade-off sits.
Images and Video: Product photography style, lifestyle imagery vs product-only, the presence of video. Video typically increases user engagement, but test whether it increases your specific conversion metric.
Pricing and Offers: Price points, discount framing ("30% off" vs "Save £12"), subscription vs one-time purchase messaging. Adding urgency (countdown timers, limited stock indicators) can lift conversions, but test this carefully. Some changes feel good but erode margin.
Navigation and Font: Menu structure, primary navigation placement, search prominence, and even font choices can affect how easily people find what they need. Test whether more prominent navigation increases user experience or adds friction.
Social Proof: Customer testimonials, review counts, trust badges. Social proof generally helps, but test whether your specific implementation moves your metric. Blog posts, newsletter signup prompts, and feedback widgets are other elements worth testing for engagement.
Understanding Statistical Significance
You've run a test, and variant B has 12% higher conversion rate. Do you implement it? Not necessarily. Variation happens by chance. Statistical significance tells you whether the difference you observed is real or just random error. Getting the analysis right here is one of the most important parts of the whole process.
The standard in digital testing is 95% confidence. This means there's a 95% probability the difference is real and a 5% probability it happened by chance. It's a balance between wanting certainty and accepting that some tests won't reach definitive conclusions. Keep this number in mind when planning the length of your experiments.
Three factors determine whether you'll reach significance:
Sample Size: The more website visitors you test with, the smaller a difference you can detect. With 10,000 users per variant, you might detect a 1% difference. With 100 users, you need a 15% difference. The chances of reaching a reliable answer increase with the amount of traffic you can send to each variation.
Effect Size: How big is the difference between the control page and the variant? A 2% difference requires larger sample sizes than a 20% difference.
Baseline Conversion Rate: A 10% improvement on a 50% baseline is easier to detect than a 10% improvement on a 1% baseline, purely from a statistical standpoint. The likelihood of reaching significance faster increases with higher baseline conversion rates.
One critical mistake: peeking at results before you reach your predetermined sample size. Evan Miller's research on this is sobering. If you peek 10 times during a test and stop the first time you see significance at p<0.01, your actual false positive error rate jumps to 5%. You're reading noise as signal. The solution: decide your sample size in advance using a calculator, then wait. Modern alternatives like sequential testing (Bayesian methods used by platforms like Optimizely) allow continuous monitoring, but they use different maths to account for peeking.
The Best A/B Testing Tools in 2026
Google Optimize, the free testing tool many companies relied on, shut down in September 2023. That shifted the landscape. Here are the tools worth considering, along with the ways each one supports different types of optimization practices:
Optimizely: The enterprise standard. Feature-rich, handles complex experiments, strong customer support. Cost matches the positioning: contact sales, often £10,000+/year. Use this if your company is running dozens of tests monthly and needs sophisticated segmentation and target audience targeting.
VWO (Visual Website Optimiser): Mid-market sweet spot at £299/month for the Growth plan. Solid A/B testing, heatmaps, session recordings, and form analytics in one platform. Good balance of features and price. Works well for teams running 5-15 tests monthly and looking for user experience insights alongside their testing data.
AB Tasty: European alternative (GDPR-friendly), strong on personalisation alongside A/B testing. Features comparable to VWO at similar price. Preferred in regulated industries. Useful for campaign-level testing and marketing teams who want to test landing pages and blog posts without engineering support.
Convert: Privacy-focused (GDPR, CCPA compliant), owned data, no third-party cookie reliance. Slightly steeper pricing than VWO but valuable if privacy and data ownership matter. Good for ecommerce in privacy-conscious markets.
LaunchDarkly and Statsig: Server-side feature flags and experimentation. Designed for engineers who want experimentation built into their development workflow. Pricing varies, but these are increasingly popular for mobile apps and modern software teams looking to ship updates with confidence.
For Shopify stores specifically, dedicated apps integrate more smoothly with your theme and admin. We cover those in the ecommerce section below.
A/B Split Testing for Ecommerce and Shopify
Ecommerce is perfectly suited to A/B testing. You have clear conversion events (purchases), high traffic volumes (even small stores get hundreds of daily visitors), and direct revenue impact. A 5% increase in conversion rate on a store doing £50,000 monthly revenue is £2,500 in new sales. For these reasons, ecommerce is one of the best places for anyone to start testing.
Product Pages: These are tested more than any other page type in ecommerce (38% of experiments). Average lift is 12-28% from changes like adjusting product image prominence, reshuffling the product description, adding social proof, or simplifying the add-to-cart flow. Test aggressive: change the layout, not just text. The returns from product page testing consistently outperform other areas.
Collection Pages: Test grid vs list view for product display. Test the number of products shown per page (fewer products means less scrolling but may feel sparse). Test filter prominence and default sort order. These aspects of your store have a direct impact on user experiences and how quickly people find what they want.
Checkout Flow: Cart abandonment rate sits at roughly 70% across ecommerce. Checkout tests are high-value. Test guest checkout vs mandatory account creation. Test form field reduction. Test trust signals at each step. Progress indicators can also make a significant difference. Every percentage point improvement in checkout completion is significant money.
Homepage and Navigation: Test featured collections, promotional banners, and navigation structure. These drive traffic to high-value pages and shape the user experience from the moment someone lands on your site.
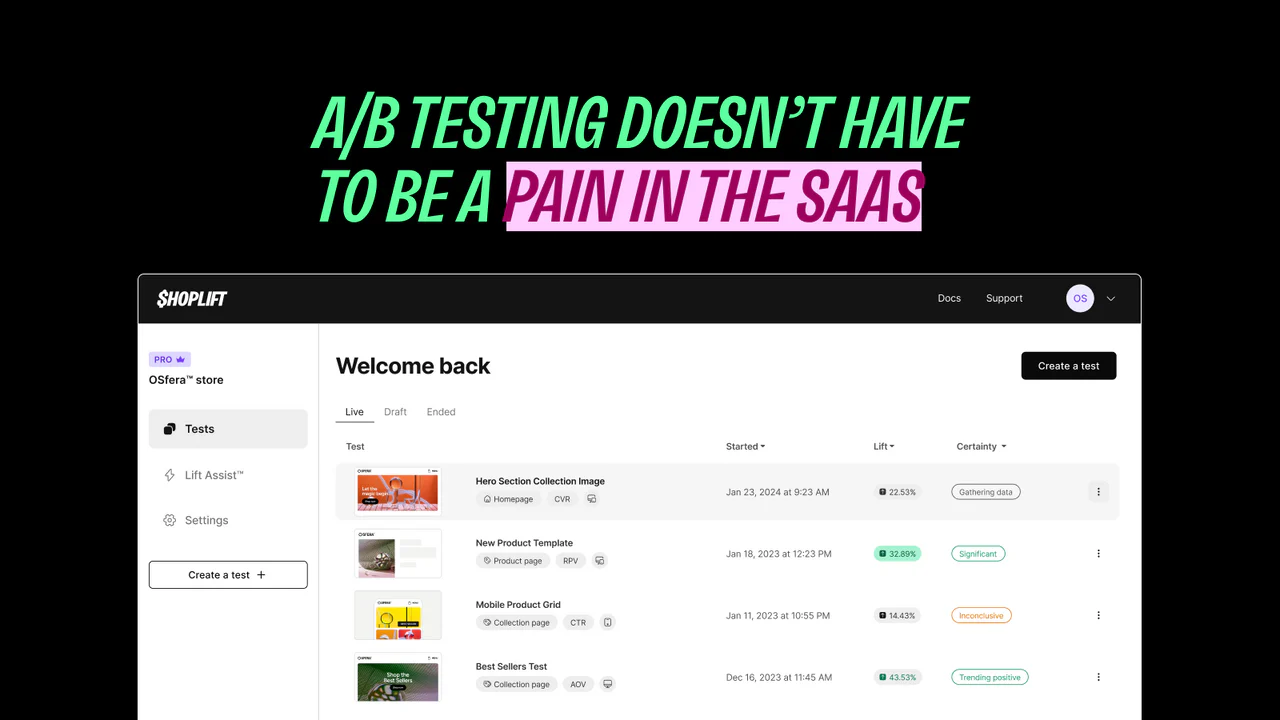
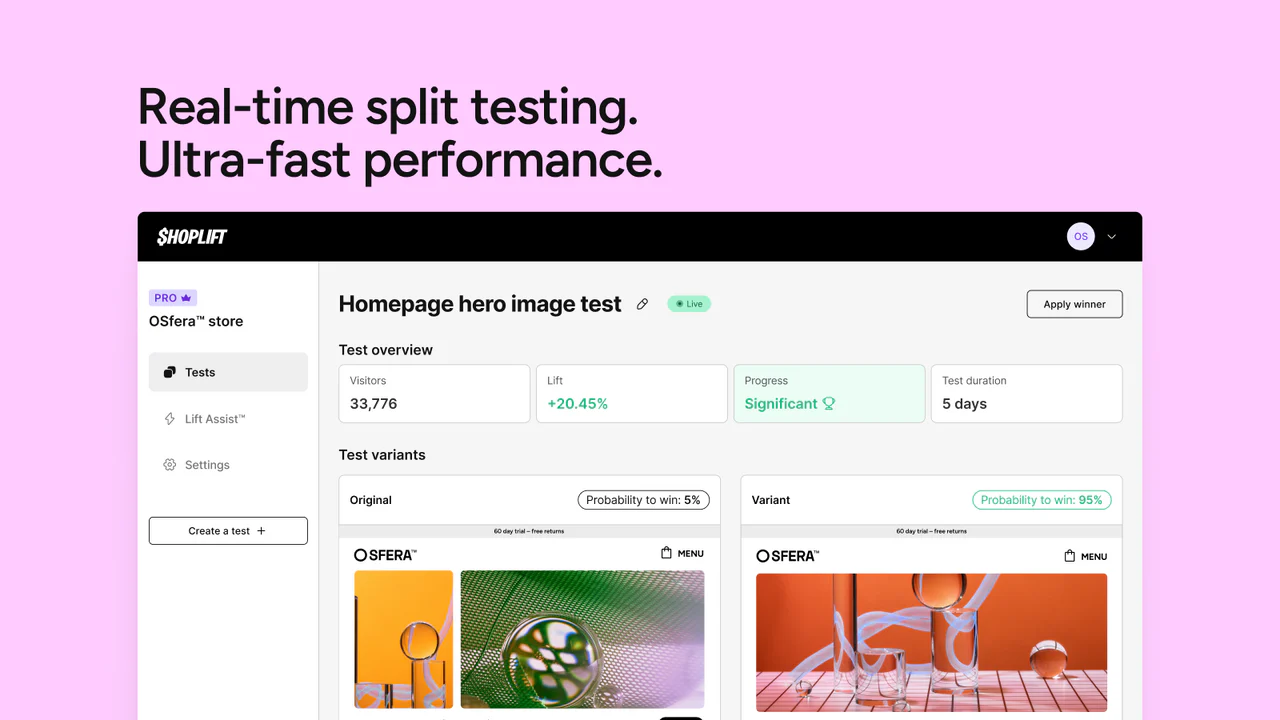
For third-party tools, Shoplift is our top recommendation. It's Shopify Plus Certified, integrates with your theme via the theme customiser (no code injection needed), and includes Lift Assist, an AI feature that surfaces statistical recommendations from your test data. Pricing starts at $74/month. It handles all the technical complexity of running tests on Shopify without touching code.
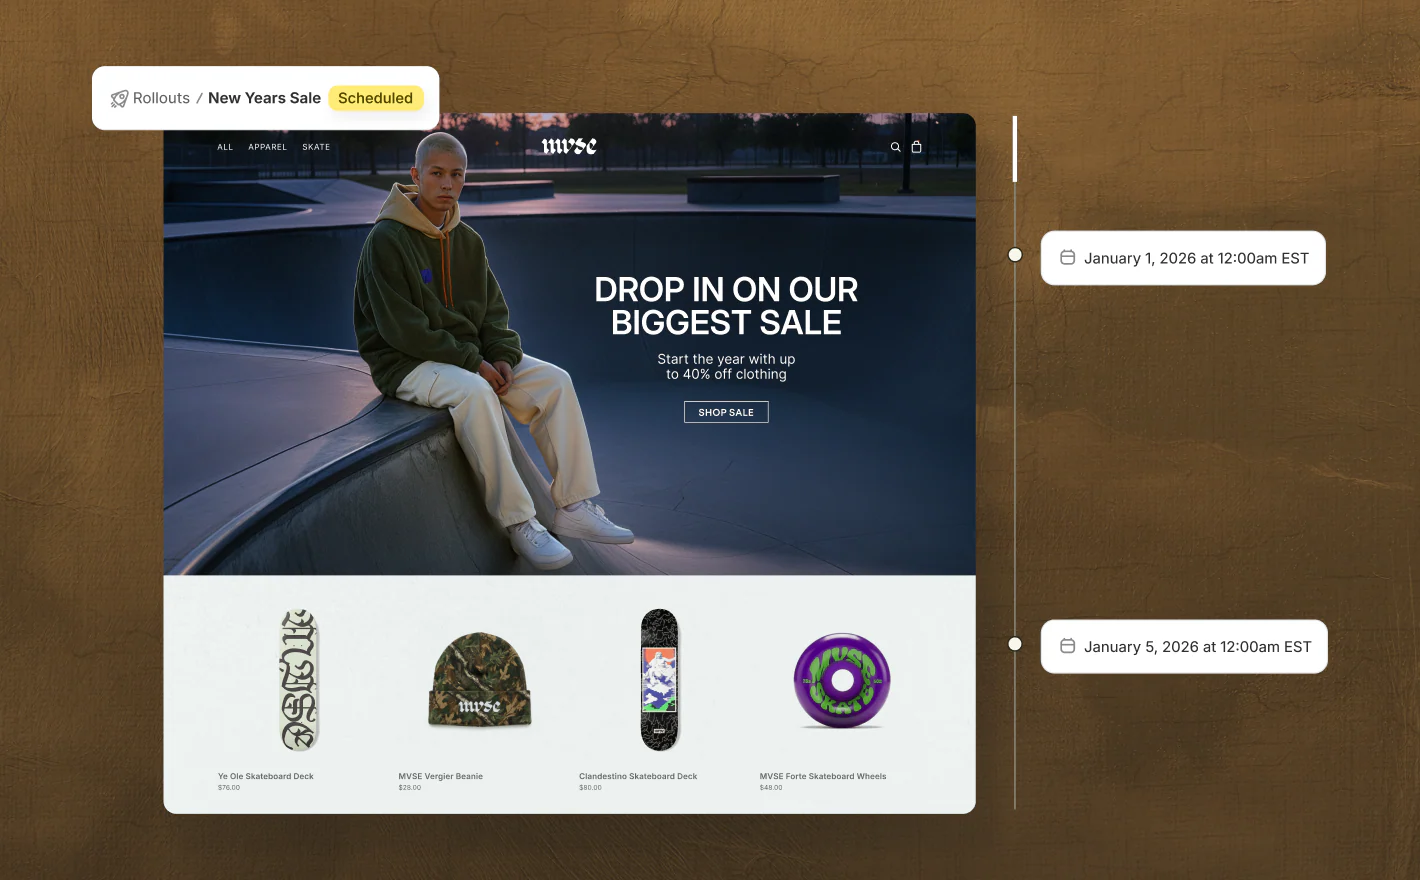
As of March 2026, Shopify now offers native A/B testing through Rollouts, available to all merchants on Basic plans and above. Rollouts lets you save theme changes and schedule them to go live at a specific date and time, set an end date so your store automatically reverts when a promotion ends, and run A/B tests that compare your changes against your current theme with real traffic. You can review the impact on conversions and select the winning version directly from your Shopify admin under Markets > Rollouts.
Merchants on Advanced and Plus plans also get market-specific targeting, so you can run a regional promotion or test changes for a particular audience, like a localised homepage for European buyers or a seasonal campaign for North America.
Rollouts is a solid starting point for stores new to experimentation, but it focuses on theme-level changes. For more advanced testing (multivariate tests, deeper segmentation, server-side experiments, or testing elements beyond your theme), third-party apps still offer broader functionality.
For a comprehensive comparison of A/B testing tools designed specifically for Shopify, see our guide on Best A/B Testing Tools for Shopify.
A/B testing is one part of a broader conversion rate optimisation strategy. If you're looking to take a more structured approach to growing your store's performance, take a look at our Shopify CRO services.
Common A/B Testing Mistakes
Lots of teams make the same avoidable errors when running split tests. Understanding the risks before you start saves wasted effort and gives your test run the best chances of producing reliable results. Here are the mistakes we see most often, along with the basics of how to avoid them.
Stopping Early: You see promising results after one week and end the test. Natural variation and regression to the mean mean you're likely to reverse course. Run tests for the full duration you calculated. Early stopping is one of the biggest sources of false positives in testing and puts your ROI at risk.
Testing Too Many Variables at Once: You run a test where you change the headline, button wording, form fields, and page layout simultaneously. If variant B wins, you've no idea which change caused it. Isolate variables so each test run gives you a clear direction on what actually moved the needle.
Ignoring Devices: 89% of organisations need separate mobile testing strategies because mobile users behave differently. A change that improves desktop conversion might hurt mobile at the bottom of the funnel. Test desktop and mobile separately or ensure your sample size is large enough to segment reliably by device.
The HiPPO Problem: The Highest Paid Person's Opinion trumps the test results. A test shows variant B outperforms, but the CMO prefers the control. Use testing to remove opinion from decisions. The rest of this article covers how to build culture where data wins.
Not Segmenting Results: You win overall, but you don't look at how different user segments responded. You might find that existing customers prefer the control while new customers prefer the variant. That insight should change how you think about rollout and the importance of looking beyond top-line numbers.
Novelty Effect: Users interact more with something simply because it's new, not because it's better. This wears off within days. Run tests long enough (minimum two weeks) to move past novelty and get a lot closer to true performance.
Failing to Document Learnings: A test ends. The winner is implemented. The hypothesis and reasoning disappear. Six months later, someone tests the same thing again. Document every test, whether it won or lost, and why the outcome surprised or confirmed expectations. Build institutional memory so your whole team can learn from each experiment.
Building a Testing Culture
Running one A/B test proves a point. Running dozens compounds into genuine competitive advantage. That requires culture shift, and this article wouldn't be complete without covering the topics and formula that make testing scale across your organisation.
Create a Testing Roadmap: Don't test randomly. Identify your business priorities (increase signup rate, reduce checkout abandonment, grow average order value), then list the experiments that will move those metrics. Sequence them logically. Pull ideas from customer interviews, session recordings, and newsletter feedback to find the topics worth investigating.
Use the ICE Framework for Prioritisation: Score potential tests on Impact (how much revenue if it works), Confidence (how likely you think it will work), and Ease (how quickly can you build and run it). Test high-Impact, high-Confidence, high-Ease experiments first. This formula helps your team focus effort where the ROI is highest and gives leadership clear direction on what gets tested next.
Document Everything: Test hypothesis, results, learnings, implementation decisions. A shared spreadsheet or wiki becomes your testing knowledge base. New team members should be able to understand what you've tested, what worked, and why. Updates should go out after every test so the rest of the team stays informed.
Get Leadership Buy-In: If leadership sees testing as a nice-to-have, it won't be prioritised. Show early wins. Demonstrate that a 2% conversion improvement compounds to real revenue. Frame testing as risk reduction (catch bad changes early) and opportunity (systematically improve key metrics at scale).
Accept Most Tests Won't Produce Dramatic Wins: Roughly 60% of A/B tests show less than 20% improvement. That's normal. These small wins compound. If you run 20 tests yearly and half produce 5-15% lifts, you're looking at 50-100% annual improvement across your key metrics. Celebrate small wins. They add up to a lot over time.
Measure Cumulative Impact: Don't judge testing by any single test run. Track year-to-date improvements across your metrics. A 3% improvement monthly is 36% annually. That's the power of systematic testing, and it's where the real traffic sources of growth come from.